So I’ve just built the DIY L-Band receiver last Saturday and have it running successfully only for a couple days.
Using the Outernet branded E4000 receiver, LNA+filter, and patch antenna.
At first the tests with CHIP were going well, but I haven’t had good experience with CHIP in terms of reliability so the receiver is set up with the latest (as of Saturday) RPi image.
The whole setup is sitting on my roof and facing South, perhaps at slightly less than a 45º angle but it is getting ~3 dB SNR. It seems to be doing better at night, but I’m not watching it constantly. I’m located in the northern US.
I’ve been trying to figure out the best way to see if reception is working reliably and few different factors seem to be at play - 1) antenna placement, 2) weather phenomena, 3) transmit-side issues. To try and isolate this I started to write a library that obtains information from one of the receiver services. There exists telemetry_client which sends information back to “telemetry.outernet.is”, but it doesn’t help for personal use in monitoring the receiver.
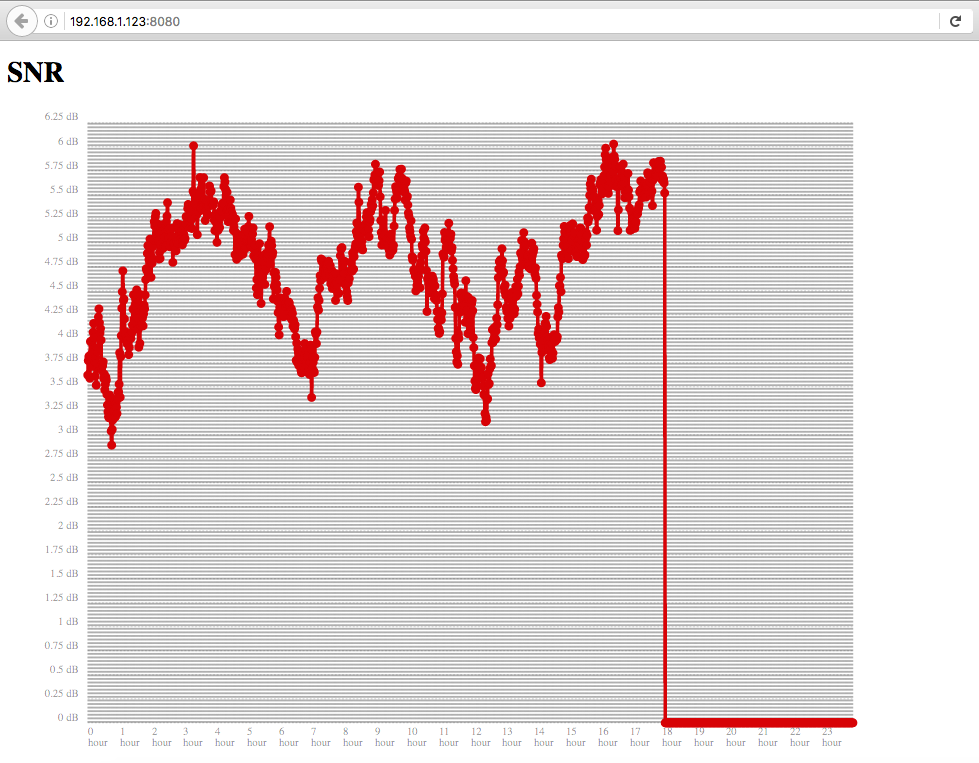
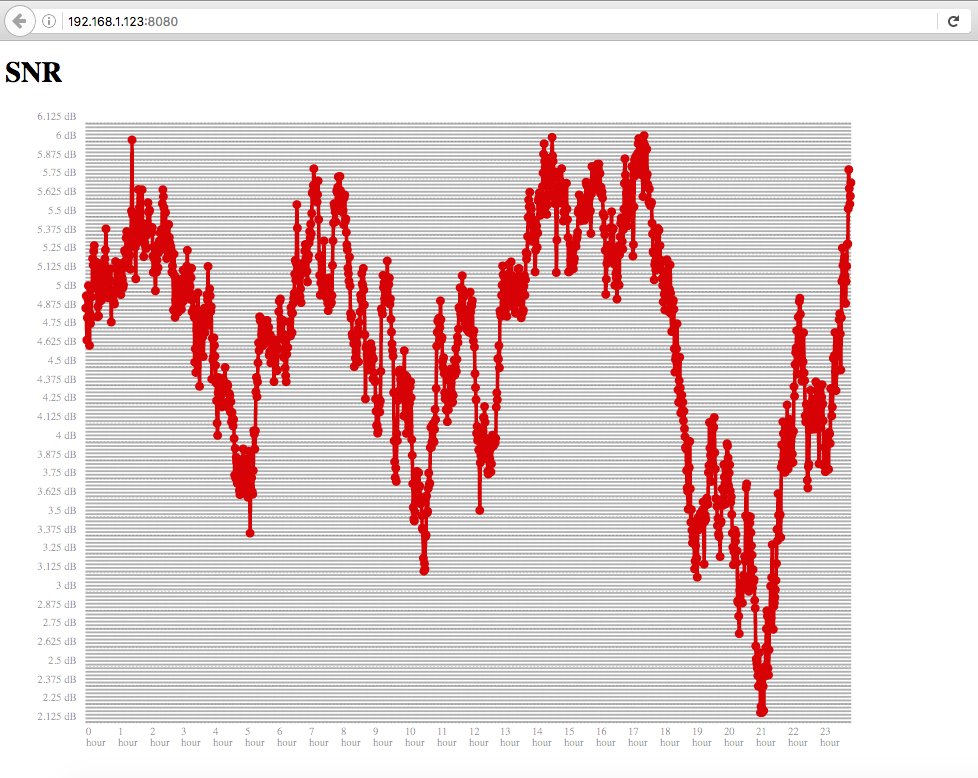
So here’s what I’ve started - a simple webserver/stats collector written in Go that runs on the server. Right now it’s just collecting SNA levels and “pps” (packets per second, not sure what the size of a packet is?) and updating this graph once per second. It might help for antenna pointing because it reacts quickly to changes. It can also be easily modified to give a full day’s overview on data transfer and SNR levels.
In the library that pulls data from the file receiver, information is collected on files successfully downloaded, state of current transfers, etc. This could help us monitor “stuck” or stale files, but have not bothered using this functionality yet.
Here’s what it looks like:

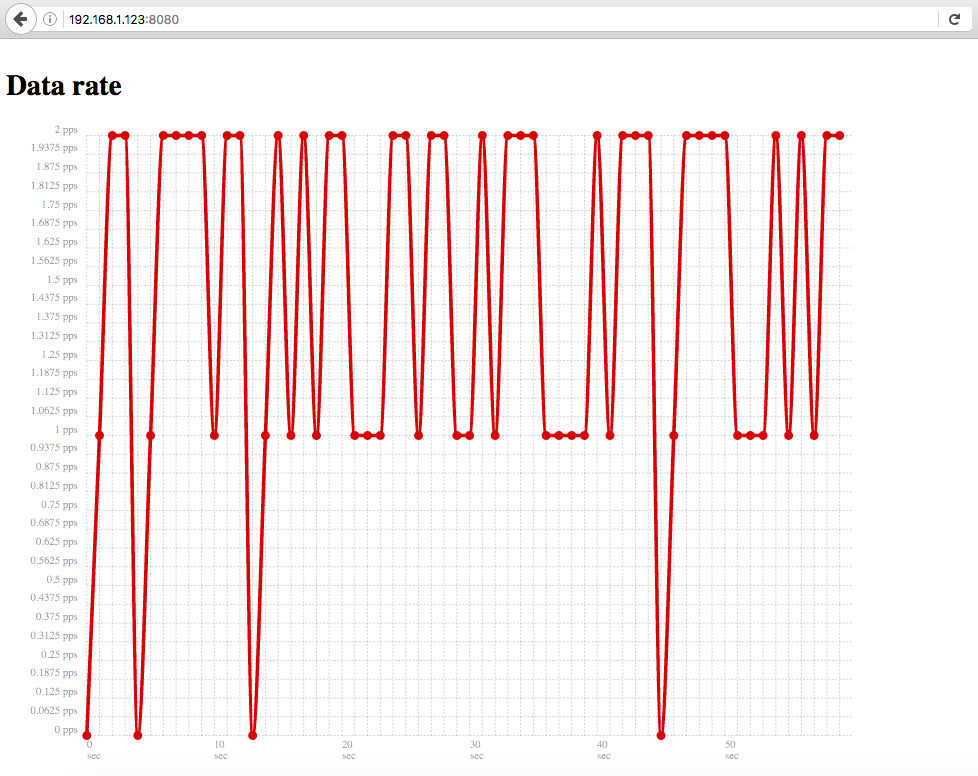
If you want to try the same, extract this tarball and run statsServer. It’ll start a webserver, then hit the receiver in your browser on port 8080 (http://receiverip:8080). You’ll start seeing SNR and packet rate graphs. Might not work on CHIP, only tested on the RPi3.
If interested in making improvements on this, the code is here.
Thoughts:
- What other data is important to keep an eye on with the receiver?
- Would anyone else be interested in sharing information and making a collaborative effort to gather coordinated data on receiver performance in different areas?